
Hey folks – long time no see. I recently presented at my favorite math conference (the Mathematics Educator Apprecation Day conference) on an intersection between math and computer science, and I thought I’d write up the gist of the presentation I wrote up the whole thing I don’t know how to be brief. Sorry / not sorry – here we go:
Some Background: A Tricky Math Standard
There’s a Common Core Math standard that I find especially tricky:
A1.F-LE.A.3: Observe, using graphs and tables, that a quantity increasing exponentially exceeds a quantity increasing linearly or quadratically
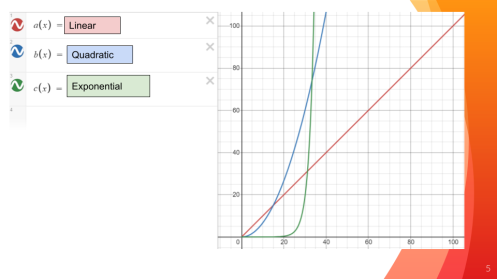
In the picture above, we see several functions growing and rising vertically as you move to the right of the x-axis. One way to…
View original post 3,165 more words
So here’s something new: I’m gonna try writing at a new blog for a while. It’s called Codey McCoderson because good jokes only get better with age. Here’s why:
I’ve spent this last year mostly out of the classroom doing quasi-administratory-things as a Math Interventionist. I’ve managed our online credit recovery program, gathered & analyzed data, and created personal relationships with our intervention students to the point where our school has a pretty robust math credit recovery program for our students who fall behind or transfer students whose credits never made it with them. I’ve also helped bring ST Math to our school (based in a large part on a recommendation from Christopher Danielson) which has been a huge boost to our ELL Math program we’ve developed. I’ve written grants for manipulatives, recruited tutors to participate in the class, and gotten to the point where basically a team of 3 teachers can support our 70 ELL students who are below grade level in both language and math, trying to get them ready for high school credits before they age out.
All of this has made engaging with this blog in the past year really difficult. I don’t have great lessons to post or student misconceptions to puzzle over. I haven’t been making worksheets that artfully scaffold basic understanding to procedural fluency to deep mathematical extensions that I can share (who am I kidding – I barely did that when I was blogging more regularly). The challenges I’ve faced throughout the year aren’t ones where writing about them can help give some clarity to solving them (which is one big way I’ve used this blog in the past) and the things worth celebrating are so steeped in context that it’s hard to share them without writing a dissertation about the demographics of the school I teach in.
But – I’ve also been teaching this AP Computer Science Principles class, which has been really awesome. I’m a big fan of the philosophy behind the class and teaching it has been a lot of fun. I’ve also been promoting the course and pushing for more Computer Science classes at my school – and, apparently I did a pretty good job, because I’m teaching all CS classes next year: Computer Science Discoveries, AP Computer Science Principles, AP Computer Science A, and an Electronics course where I think we just get to play with microcontrollers and robots for a year. I also became a PD facilitator for Code.org (I used most of their curriculum while teaching Principles this last year), so if anyone will be at TeacherCon in Phoenix: I’ll see you there. This is all pretty exciting and, since I’ll be back in the classroom more often next year teaching something pretty new, I suspect I’ll have more to write about.
Anyway, I decided to create a new blog exclusively for my Computer Science adventures: Codey McCoderson. I’m hoping the ‘blank slate’ setting will help re-acclimate myself to the process of writing about my teaching, and I like the idea of preserving this blog as it stands – a time-capsule of sort from my first 5 years of teaching. So, if you’re interested in reading about me trying to teach Computer Science at all sorts of different levels, maybe you’ll enjoy Codey McCoderson.
So this year I’ve been teaching a brand new class called AP Computer Science Principles – and, it looks like next year my entire teaching load will be computer science classes. And that’s awesome and exciting and totally up my alley. Let’s talk about all of that.
Hey #MTBoS – long time, no see. I wanted to stop in and share something kinda cool I did with my AP Computer Science Principles class (wait – what?)
I’m teaching a brand new course this year, AP Computer Science Principles. I’ve mostly been following the curriculum provided by Code.org, which has been excellent – I dig their philosophy of providing open Creative Common licensed resources to benefit everyone, and I’m totally bought-in to their underlying principles of equity and ‘this is not just another coding class’. One of the big ideas of the course is Big Data – the idea that computer scientists manipulate and transform data into something presentable and look for actionable patterns or trends.
I had been looking around online for different ideas of how to address Big Data and, frankly, I wasn’t satisfied with what I was seeing. Most places suggested having students create a survey, have lots of people take it, then look at the data and perform some analysis on it to identify trends and patterns. I disliked this for two reasons, both of which come from my experiences as a math teacher and being acutely aware of psuedocontext – wrapping up a task in an inauthentic experience. Since the survey is a means to analyze the data rather than the true focus of the unit (as it might be in a statistics class), this almost necessitates that it be superficial and quick and and probably won’t lead to any truly meaningful insights – not great. I also didn’t like that a ‘large’ survey done this way would have maybe 100 data points, which isn’t anywhere near what a truly ‘large’ data set is in the computer science world.
If I was going to do this unit, I wanted students to look at real raw data on a scale where it is only feasible to use a computer to analyze it and whose analysis could provide real insights. So, I went around looking for raw data sources and found this Forbes article that pointed me to a lot of good places, but it wasn’t until I found FiveThityEight’s Elections page that I really got excited.
I don’t really know what else to title this post, but I’m about to share a few adventures I’ve had in improving my programming skills to make some problem-generators that’ll make my life easier. This is less of a reflective post and more of a “look at this!” post.
Our Algebra I curriculum starts the year by introducing students to a plethora of terminology to describe functions – linear, quadratic, increasing, maximum, continuous, discrete, etc. The curriculum then exposes students to a variety of graphs and asks them to classify them based on their properties. It then takes it a step further by developing stories to fit each type of graph – what type of story leads to a linear versus a exponential graph; what kinds of stories have maximums versus minimums; etc.
When I taught Algebra I, I found myself wanting to quiz students strictly on the vocabulary, which meant I needed to generate lots of graphs with lots of different properties and be able to categorize these graphs so I could discern correct vs incorrect answers.
This was my first attempt, made about a year ago: http://schneiderisawesome.com/desmos/oldGraphProperties/classifyinggraphs.html. It gets the job done, but its kinda hacked together. Drawing a continuous line by stringing together discrete points was fun. testing the checkboxes is done very literally. You can also click on the graph and a new window will pop up with the graph converted to an image, which let me copy and paste those into worksheets like this one.It worked okay.
Since then, I’ve increased my code-fu. I’ve learned Bootstrap, a bit of jQuery, and some Angular basics. Angular in particular had the annoying property of, initially, being more work and causing more confusion rather than saving time and effort. Only recently has it reached the point where I feel like I’m truly harnessing its power for time and efficiency.
But, the most exciting new thing I’ve started to play with is the Demos API. Having the power of the Desmos calculator at my fingertips was an incredible motivator to see what else I could come up with.
With Desmos as the catalyst, I updated my graph categorization program: http://schneiderisawesome.com/desmos/graphProperties/graphProperties.html. It’s way better and has more functionality, especially now that I don’t have to worry about the graphing part. I also really love how easy it is to add a ‘test’ button for people to test their predictions before submitting, since all I need to do from a programming standpoint is plug their expression into the Desmos calculator. I wish discrete graphs were easier to make and I wish there was a way to customize point size & line thickness – but other than that, things look gooood. So, now that’s out there for me to use with my students.
That was actually the second program I made with the Desmos calculator – the first one was focused solely on linear equations and was more of an experiment with Angular and Bootstrap rather than Desmos: http://schneiderisawesome.com/desmos/linearEqn/linearEqn.html. I wanted a way for students to test their abilities to write linear equations given two points, which is basically all that this program does.
So – now those programs are out in the open. They were fun to make and hopefully they’re somewhat useful.
Previously: ELL Math – 3 Weeks In
In between then and now:
- We’ve talked about fraction operations to decent success, decimals to mixed success, comparing numbers & comparing fractions to great success, and translating between English and Numerals (ie: fifty two thousand five hundred and six = 52,506) to decent success
- I have a group of students that I’m trying to prepare for Algebra I next year, who’ve been exposed to: order of operations, simplifying expressions by combining like terms and with the distributive property, solving 1-step equations, and writing linear equations from a context (ie: Joe has $5 and makes $2 per hour = 2x + 5).
- Less than half of the students I have now were with me at the start of the semester: many students have left, many students have joined. My class needs to be flexible enough to adapt to the changes.
- We’re still doing Khan Academy, which exposes students to other topics I haven’t taught as a full group: mixed numbers, simplifying fractions, etc.
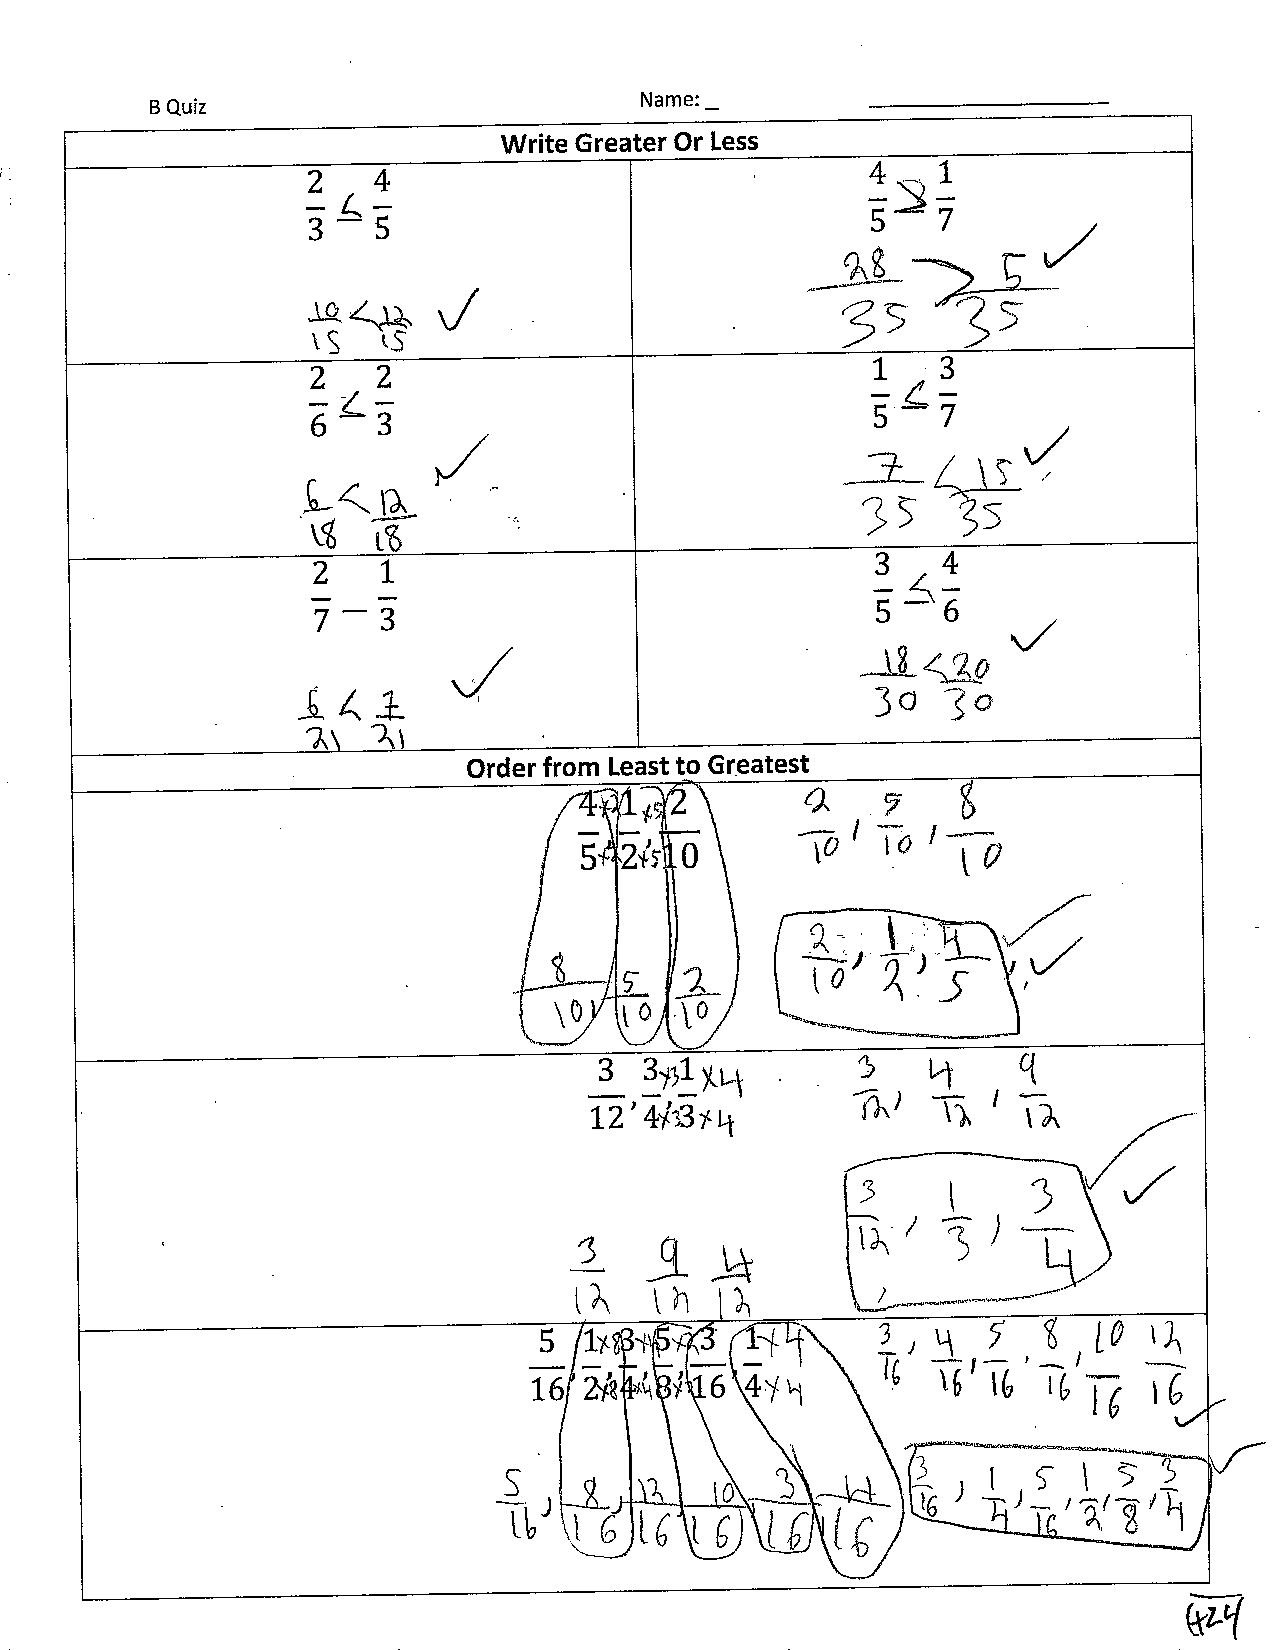
Basically, at this point in the year, students have been exposed to a ton of different content and lots of different strategies to solve whatever math problems come their way. One of my favorite things is to see all the different strategies in action – one student may have latched onto a physical model for multiplication while another student does a repeated multiplication strategy; some students combine positives and negatives using the number line while another group may use a physical model by drawing open and closed circles. It’s been pretty fascinating watching all of these strategies play out and seeing which students have become comfortable with the procedural short-cuts that we try and move students towards (when comparing fractions, make the denominators the same and just compare the numerators) versus the students who still need that conceptual foundation to solve the problem (when comparing fractions, draw the two fractions and compare which one has the greater shaded area).
So, here’s a snapshot of a quiz I gave last week showing where we are and the strategies students are using to get here:


Some Comments:
- I’ve started splitting the class into A, B, and C groups so I can differentiate content and problems, which is why there are 3 different versions of the quiz. This helps me with a lot of logistical things I was trying to figure out in terms of only having one gradebook but several different levels in my room.
- Somewhere in there is a student who solved the comparing fractions problems by making a common denominator and comparing the numerators, but solved the ‘least to greatest’ problems by drawing the models. I wonder if that was intentional – if that student felt the models were easier for the least to greatest problems – or if that student didn’t realize that the former strategy can also be used for the latter problems
- Teaching students to create a common denominator has made me appreciate the difference between these two questions: “What is 18 divided by 2?” versus “2 times what equals 18?”. The latter question is the one that my students struggled with more than I had initially expected but, in retrospect, I see now that this latter question requires a different type of trial-and-error thinking than the former one, but you need this type of thinking if you want to solve the least to greatest problems in a procedural way. It made me re-think how I would teach multiplication next year – I would try to include more of these types of questions earlier to reinforce the relationship between multiplication & division.
- I’ve realized that the commutative property of multiplication is not as obvious as I’ve always believed it to be, especially when you create a model to represent the multiplication. I’ve had some good one-on-one discussions around this point.
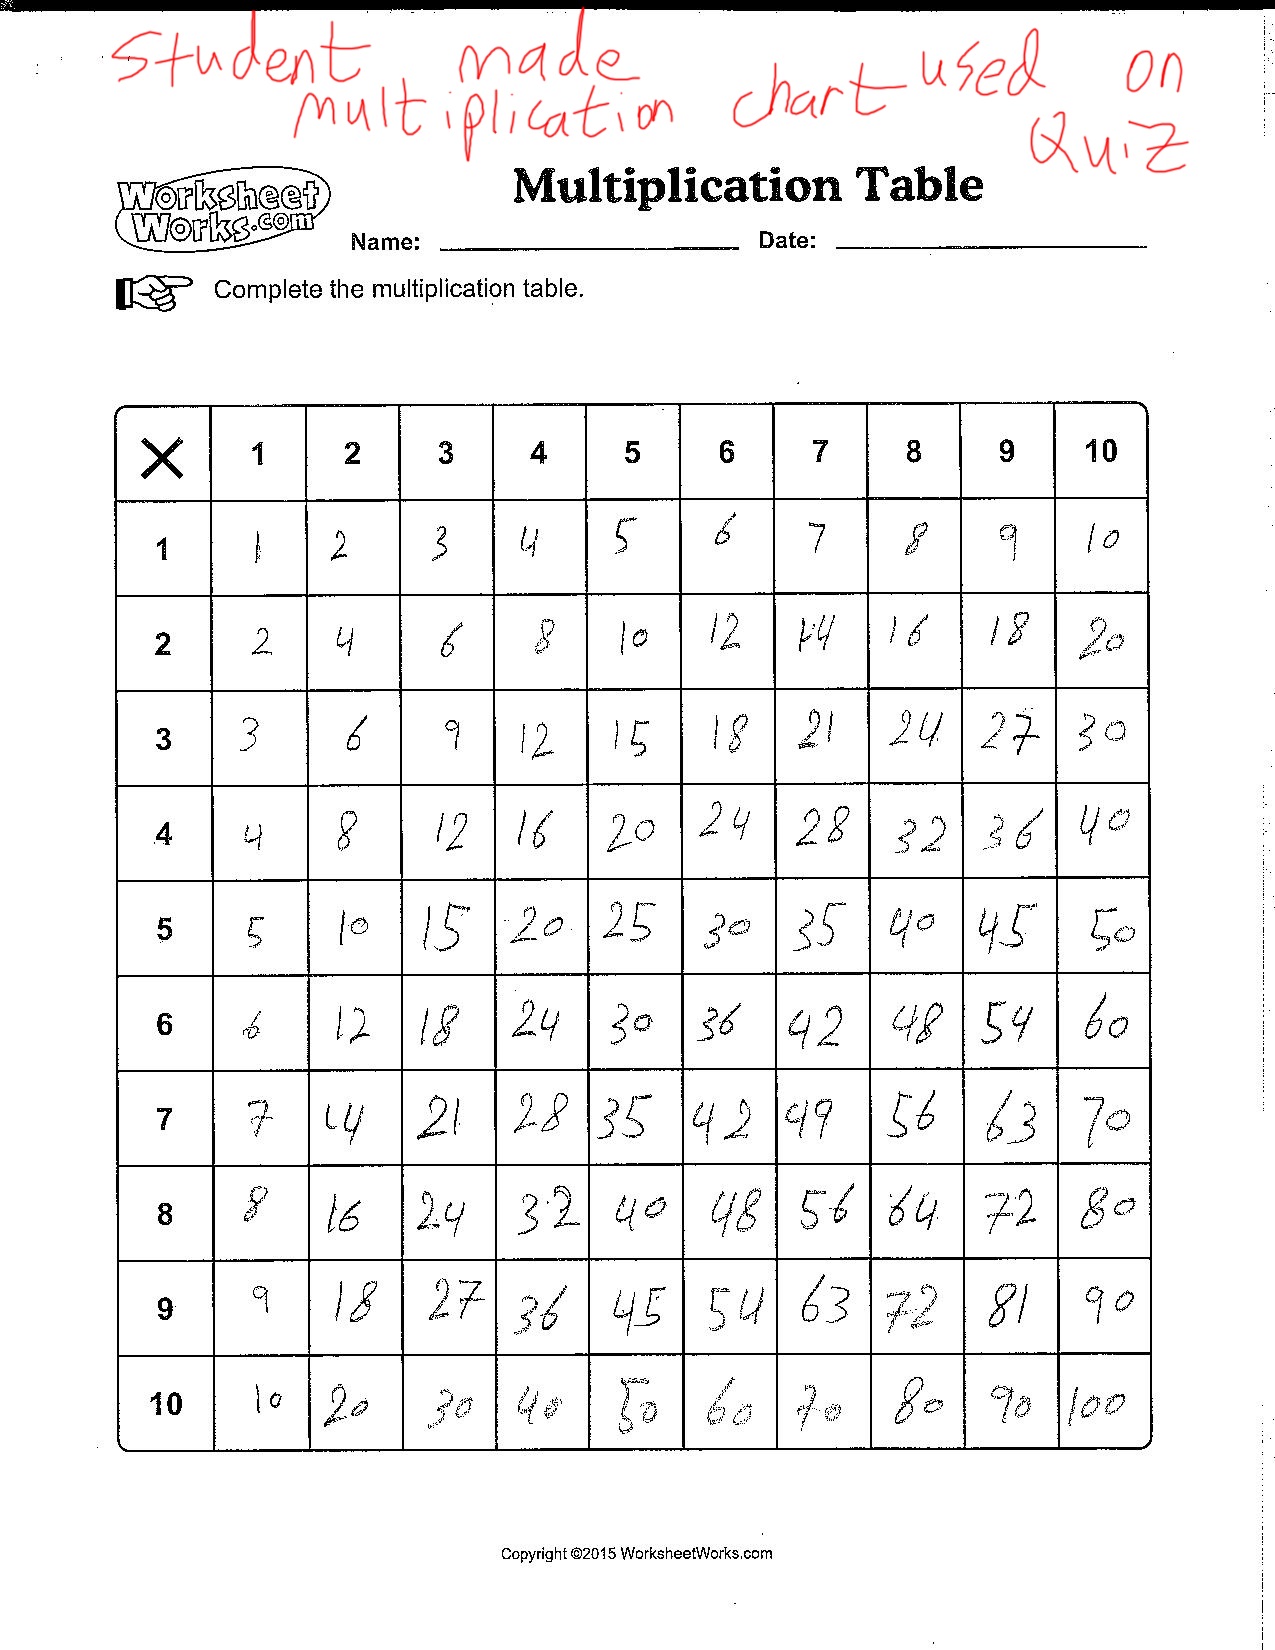
- I’ve had a shift in opinion about the role of multiplication tables. I didn’t like that using tables removed some of the cognitive burden from all future multiplication problems or that, frankly, students would just use a neighbors table instead of making their own. Multiplication problems became an exercise in looking up data in a table rather than an application of a conceptual understanding of multiplication. I used to think that these tables were a crutch that students should be steered away from – instead, if they need to multiply something, draw a picture or make a model to solve the problem.But, when I would tell students to do this, I started to see is that students weren’t realizing that they can re-use their models for similar multiplication problems. For example: I would watch students multiply 7 x 6 by drawing 6 rows of 7 dots, then move on to multiply 7 x 7 by drawing 7 rows of 7 dots without realizing they could just add one more row to their previous drawing. And, since the commutative property of multiplication isn’t immediately obvious, 3 x 7 and 7 x 3 would result in two different models. This reliance on models and the time it took to draw them was starting to discourage students and distract from the other topics we were discussing (ie: adding & subtracting fractions with unlike denominators).
So, instead what I’ve started doing is: students can use premade tables during class, but they can’t use them on quizzes or tests. However, I will give them a blank table which they can fill in as part of the time it takes for them to complete their quiz. I like this system because they are still doing cognitive work and convincing me they know how to multiply when they make the table. This is also a totally valid strategy for any other test they take in any future class – if you need a multiplication table, take time to make your own.
- I discovered that the Marcy Math Pizzazz worksheets, while generally below my rigor expectations at the high school level, are a decent quick resource for additional problems at the middle & elementary school level. They are especially helpful because they allow for self-checking. Several students prepared for this quiz by working through problem sets from that book. It also makes my differentiation efforts a lot easier to manage.
So…. there are some updates on what I’ve been up to. Lots of fun.
I have a pretty good relationship with the universities near my school – they tend to send pre-service teachers to check out my classes as part of their observation hours. This semester was no exception – I had a pre-service teacher come twice a week to watch my freshmen intervention classes.
Whenever I have observers, I give them a notebook during class to write down any questions they have about something they see in class but don’t really have an opportunity to ask about. Why did I answer this student’s question a certain way? Why did I handle this interaction a certain way? Why is the classroom arranged like this? Why did you teach this lesson in this way? What was going through your head when this happened? I imagine what it would be like if my room was being videotaped and we were watching the replay – the notebook has all of the questions they would want to ask during the replay, but can’t because we’re not actually recording my class.
The result is usually an interesting relic of things that have happened in my class – moments that I reacted to and hints at the lesson I was teaching. It’s also a reflection of the types of issues and questions that the observer has as they watch – are they looking with an eye to classroom management? to instructional delivery? to classroom arrangement? to curriculum choices? Are the questions big and philosophical and reflective and ideological? Or are they detail-oriented and logistical and fine-tuned to specific aspects of my classroom?
The pre-service teacher in my room this year had some pretty stellar questions (she’ll be an awesome teacher one day), which led to about 40 handwritten pages of me reflecting on lots of things in my classroom this semester. On re-reading the entire notebook, I realized it captures a lot of thoughts and beliefs and tangible things I do in my classroom as a 5th year teacher working mostly with intervention students. So, I decided I wanted to immortalize it here in this post since I think it’s pretty fascinating and it’s another artifact in my curious evolution as a teacher, which has pretty much been entirely documented on this blog.
So – if you’re interested, here’s the entire question-and-answer notebook in a single document from Scribd:
And here is each week separated into separate PDF files:
Hope its worth the read. Sorry/not sorry for my handwriting.
I’m still figuring lots of stuff out with my ELL mostly-refugee students and I’m loving that I get to process it all through this blog. Here’s what’s on my mind:
Fractions
We started going fractions, which has been going really well. My general classroom structure is to pick a topic for the week, go over it every day, then quiz on it on Friday. Last week was just representing fractions – things like writing a fraction given shaded pieces or given a point on a divided number line. I made these Geogebra programs to help me with the practice problems and to keep the visual theme going:
Writing Fractions from Visuals: http://tube.geogebra.org/material/show/id/1754581
Writing Fractions from Number Line: http://tube.geogebra.org/material/show/id/1754587
Once we had the concept of identifying fractions, we moved onto combining fractions with common denominators. Here are some artifacts from how that went:


Some Notes:
- If I had it to do again, I’d add a third box to the worksheets for students to draw their answers too.
- I love that I was able to circle back to positives and negatives, but now in the context of fractions – so, I get to hit the skill again, but not in a way that seems repetitive and like we’re spinning our wheels moving nowhere. It was also a really easy transition to represent fractions with +’s and -‘s instead of just shading them in, so our visual language of ‘zeroing out’ was re-used with these fractions.
- Most of problems were along the lines of: given a symbolic fraction problem, draw a picture to help answer it. However, my favorite types of problems were actually the reverse: given two pictures of fractions, write the symbolic representation and then answer it. These really helped cement the visual language I wanted them to use.
- For the most part, the students who drew pictures got correct answers, whereas the students that didn’t tended to get incorrect answers (not pictured). Even some of my more advanced students reverted to drawing pictures to check their work. Seeing that was one of the most tangible manifestation of one of my biggest overall teaching philosophies: teach a representation and rules on that representation, then let students recreate that representation to solve problems. This is basically my philosophy behind everything in this class – the symbols have a visual representation and rules on how they interact which gives you the answer. The students who took the time to create the representation tended to get correct answers – the students who moved too fast got incorrect answers.
- Some students still struggle to identify the sign of numbers without anything in front of it. For example, in the expression “3 – 5 + 4”, students are confident that the 5 is negative and the 4 is positive, but are unsure of the 3. This is curious to me and I don’t really know how to fix it other than “if there’s nothing there, it’s always positive!”, which is an arbitrary rule and is hard to communicate in the absence of a common language. For some students, I wonder if its because their native language reads right-to-left whereas they are suddenly learning a language that reads left-to-right.
The plan after this is to go into fraction multiplication, then into combining fractions with different denominators. For a while I was struggling with how to teach this visually, but this demo lesson from ST Math was invaluable in informing how I’ve been teaching fractions: http://www.mindresearch.org/play/. I use it with every student now, even my non-refugee students.
Also – I wish I could erase the part of my brain that wants to draw a circle as the default way to represent fractions. From a pedagogy standpoint, everything is much easier to teach if I default to drawing an array of rectangles of a number line (but especially an array of rectangles). A rectangle divided into fractions segues segues to fraction multiplication easier, it segues to decimals easier, and its easier to draw and manipulate if I make a mistake while drawing.
Khan Academy
When I’m not teaching full-group lessons, my students work self-paced on Khan Academy (more info here). The self-paced aspect is working great as is the alignment between what I’m doing full-group and what they work on individually. For the earlier exercises, KA also has lots of different types of exercises for students to work on with multiple representations, so students get lots of practice on the same thing even though they’re progressing through the curriculum.
In general, I think the ‘Missions’ are pretty useless with my students – there isn’t a lot of logic to how the problems are generated and it all seems chaotic. My students get frustrated and want to give up in the face of being unsuccessful and not seeing how the previous exercises connect to the next exercises. However, if students have been working through individual exercises, then they can use the ‘Mastery Challenges’ to revisit exercises and gain ‘mastery’, which I like. I had my students do this for a week and had them skip the ones they had never seen before. It was especially interesting to see them work on the Early Math problems – many of them are explicitly language based (like these ones on ‘shorter’ and ‘longer’ and ‘bigger’ and ‘smaller’), so many of my students learned how to use Google Translate to answer these questions, which I thought was a valuable teaching moment even if it wasn’t necessarily a ‘mathematical’ teaching moment.
Khan is also really good at adding new exercises – almost as if they read my mind, they added a Multiplication Using Array’s exercise this week, which is pretty much exactly how I taught multiplication to students. But – I wish there was a place where I could see when new exercises are added or updated (I asked them on twitter, but no response). I just happened to ‘discover’ these ones – it’d be great to receive email updates or an rss feed or something when new exercises are added.
ST Math
Christopher Danielson recommended this program called ST Math for this class since their philosophy is almost entirely aligned to my goals in this class: start with the visual, then add in the symbolic later. Running through the Demo lesson linked above, it seems like a pretty awesome program for this very specific demographic. I’ve even convinced my school to look into purchasing it, but we’re having a lot of trouble getting a hold of someone from the company who we can talk to about buying the program. So, if anyone from ST Math happens to read this, I’d love to get in touch to look into using this software in my classes.
Artifacts
We started Multiplication this week. I needed a quick way to determine if students knew their multiplication tables or not that segued quickly into me working with the students who had no concept of multiplication. I decided to give 3-minute Multiplication Fact quizzes all week – the students who knew their facts completed the quizzes quickly and bought in from the challenge of improving their scores and the competition of comparing their numbers with their peers. The students who needed me to teach them multiplication were clueless on the quiz, but since it only lasted 3 minutes, I could quickly see how they were doing and start remediating immediately. By the end of the week, here’s what their work looked like:


Some notes:
- I defaulted to showing the area model because it’s the most visual of the models. Most kids gravitated to that. By the end of the week, some students got tired of drawing all the circles and wanted a faster method, which let me show them how keeping track of each column let you build a multiplication chart so you didn’t have to draw circles for every problem.
- Some students used the ‘count the tallies to create a chart’ method (similar to skip counting), but since language is an issue with my students, counting was also an issue and these students tended to make smaller counting mistakes (pointed out about with red arrows). The students who used the visual models tended to fair better than the students who tried to rely purely on the symbolic/procedural models.
- In one of the pictures above is the Lattice Method, but its crossed out. I showed this to several students, but no one latched onto it, which I thought was curious because it’s also very visual. In thinking about next week (division), I’m actually kinda glad no one latched onto it – it’s pretty straightforward to show how to divide using the same area model and the tally model that you use for multiplication, but the lattice method is a little less straight-forward to reverse-engineer to get division.
- Check these out:


This is from my student who had absolutely no concept of multiplication – she thought the ‘x’ symbol still meant ‘add’. I showed her the area model, but she has trouble counting past 15, so I also told her to cross off circles as she counted them – every 10th circle, write ’10’ on the side, then start over. Using this strategy, she was basically grouping circles by 10s, then adding all the groups together to get her answer. This was the basis for my comment on twitter: I’ve never appreciated place value and grouping-by-10 than when my students can’t reliably count past 15.
- I thought this was curious: several students used this strategy

In other words: students doubled one multiplier while halving the other multiplier, then added the former number as many times as the latter number. So 7 x 8 is the same as 14 x 4 which is 14 + 14 + 14 + 14. I was surprised several students did this by default without needing to be shown this ‘trick’ – very clever.
- I give a quiz every Friday over whatever weekly skill I decide to cover. This week was a 20 question quiz that was all multiplication problems. Every student passed, even the ones who spent the whole period creating their models and only learned multiplication on the Tuesday (we had Monday off from Labor Day). I feel like this is the only way this class can work – every skill needs a model that students can create on their own and use to solve problems, even if it means it takes much longer than might be considered ‘reasonable’.

